UDL Possibilities enabled by technology
What follows are a collection of ideas/tools that could be used to write a student activity. While they may not strictly fall under the UDL umbrella, all of these ideas enable visualizations or learning methods different from reading and writing. A lot of emphasis is placed on visual representations (essential for understanding science) and collaboration (another essential.)
Using these types of technology, a student could progress through an activity working on a single computer, but interacting with the class, seeing visual representations of scientific concepts, taking data and using models. The student could report using drawings, spreadsheets, words, speech to text, graphs and other methods.
Assessment/Input Options (Collaborative)
1. Multiple-choice question with polling.
Based on the standard multiple-choice format, the student would be able to see an aggregation of the class answer upon submitting his or her personal answer.
For example,
| |
Rain, snow and sleet are forms of:  Upon sending the answer, the student would see the class results. 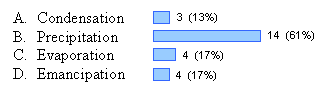 |
2. Essay answer with group results
Student can give an essay answer (or justification for a multiple choice). Upon submitting, student could be able to see everyone else's essay answers. Could be shown anonymously - no student identifiers on classmate answers.
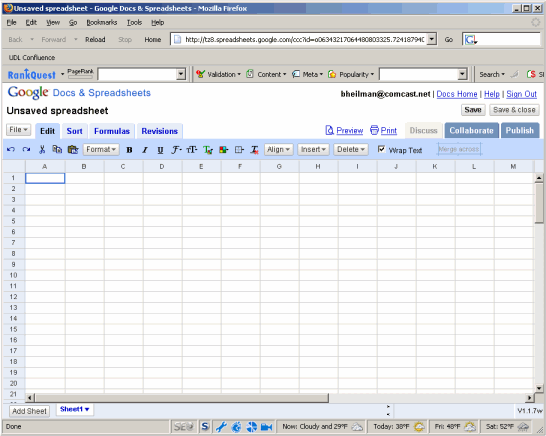
3. Spreadsheet.
Perhaps similar to the google spreadsheet (or the actual google spreadsheet) this would be a fully functional spreadsheet allowing the student to do calculations. It would also allow a class to enter data from the computer they were working on into a single web-hosted spreadsheet. An excellent way to compile group data and create a group chart or graph. Averages, etc could be calculated automatically. Google version allows invited users to chat and discuss while adding data.
http://www.spreadsheet.google.com
4. Visual Ranker (Intel tool)
A visual sorting tool that allows the student to organize ideas visually. It also allows the student to see what the class average is (what were the most common rankings.) A working version of this type of tool is featured on the intel site at:
http://www97.intel.com/workspace/tryit/VRTryIt.aspx?LID=en
| |
 |
4. Drawing Tool.
Ideally this would be the current drawing tool or the tool featured on confluence. It would also allow the user to take a screen grab, place it as the background of the drawing, and crop this background. This would allow the user to answer questions by annotating snap shots of a model, animation or other graphic. It might also allow multiple documents so that the student could annotate multiple images (or draw multiple images) to create an answer. (Perhaps with a flip to next page option like Sketchy).
5. Prediction Graph
Similar to TEEMSS2 version. Might have collaborative mode.
Visualization Options
Some of the visualization options listed here could also be input mechanisms. For example, the student can indicate choices through interacting with Flash or a model.
1. Flash Animations
Authoring environment can pass variables to flash, and accept variables from flash, that can be passed to other objects (Molecular Workbench models, graphs, drawings, etc).
One flash animation type would be the zooming from macroscopic to microscopic and vice versa. An 6-level example flash has already been created to go from an ocean view of water to a "particle" view of water. An example of a flash animation is shown below.
Clicking on the 6 black dots will change the zoom level from macroscopic to microscopic
| |
Unknown macro: {flash} |
This flash could then pass a signal to authoring system to launch a MW model.
2. Smart Graph
3. Molecular Workbench
4. NetLogo
5. Sensors
Communication Options
1. Large Text / Small Text Preference
As descibed briefly in UDL User Interface Concepts, this might be a function of an interface "skin" that the student chooses, or it may be a modifiable feature of any skin. The user can set a font size preference for the normal text and perhaps the headers.
2. Language Preference
Through a preferences interface, I can choose English, Spanish or other available languages. This choice effects written words (text on screen) and spoken words (either through human audio-clip or computer generated voice.)
3. Spoken Text
The student can choose to have spoken text available (or this may be a teacher option!).
4. Sign Language Avatar
This one is pretty cool. Check out this link: http://www.vcom3d.com/
This is a company that makes a signing avatar and an interface for converting text to 3-D signing animation. Note the TERC is working with them to create a science vocabulary. The contact information and project description can be found at: http://signsci.terc.edu/ You can view a movie of the avatar signing at http://www.w3.org/WAI/RD/2004/06/sims-mov.htm